Monitor Attendance Changes
Something that BI does really well that MIS systems often don’t is monitor changes to indicators over time without having to separately filter for each time period. That’s the topic of the second half of this post, experienced developers might want to skip forward but first I’m going to go over date tables, why they’re useful and how to make them.
Date Table – what and why
A date table is a table with one row per day used to control other tables that have daily records, so in the case of schools usually attendance and behaviour. There are three big advantages of using a separate date table rather than a slicer directly on the field Attendance[Date].
- It makes it easier to filter groups of dates like academic years and terms
- You can control multiple data areas with a single date slicer
- The slicer will load quicker because it’s fed from a smaller table
- Certain "time intelligence" DAX functions will work better
How you make a date table
You can load your own date table from a data source like your MIS and if it can produce a table that has a row per date along with the academic year and term then that’s optimal. If not, don’t worry you can make one with DAX. Select New Table from the modelling tab and use the code:
DateTable = CALENDAR("01/09/2019",TODAY())
The start date can be whenever you like (but don’t go back further than you need) and TODAY() means the last row will always be today’s date. If you need to look into the future than you can use TODAY() + a number of days as adding or subtracting integers to dates in DAX changes them by days just like in Excel.
Adding Academic Year
I recommend having two academic year columns, one an integer which allows you to back and forward and the other text in the format 2020-21 which is more intelligible for the user in slicers etc. For the integer column I use the year the academic year ends – so 2020-21 = 2021 but that’s personal preference and it doesn’t matter what you choose as long as it’s consistent.
To create the year columns add a couple of calculated columns to DateTable:
            AcYear =
            VAR M = MONTH(DateTable[Date])
            VAR Y = YEAR(DateTable[Date])
            RETURN
            IF(M>8,Y+1,Y)

            AcYearDisplay =
            VAR M = MONTH(DateTable[Date])
            VAR Y = YEAR(DateTable[Date])
            RETURN
            IF(M>8,
                Y & "-" & Y-1999,
                Y-1 & "-" & Y-2000)
Adding Terms
Terms are trickier because you can’t work them out from the date alone. If you can get a separate table listing the term dates from your MIS then don’t worry – you can enter them using the ‘Enter Data’ function on the home ribbon. If you copy values from Excel you can paste them straight in. This creates a query with the data in it - later on if you need to edit the values or add rows you do this by opening Power Query with Transform Data, then clicking on the gear next to the Source step of the query. Once you have a TermDates table you can look up the term in a calculated column of your date table like this:
            Term =
            VAR D = Datetable[Date]
            RETURN
            CALCULATE(SELECTEDVALUE(TermDates[Term]),
                            TermDates[StartDate]<=D,
                            TermDates[EndDate]>=D)
SELECTEDVALUE is a very useful DAX function that returns the value of a column when it has been filtered to contain a single value only (or else it returns a specified alternative result or blank).
Create Relationships and mark as date table
Now that your date table is made you should create relationships between the date table and the date field of your attendance and behaviour tables. It’s possible that your MIS gives you these as date time fields – if so the best approach is to use power query to add a copy of the field, then change one data type to the date and the other to time so that the date and time pieces of information are stored in separate columns. As well as facilitating the use of a date table this also aids memory compression so is worth doing for that reason alone.
Finally select the table in the fields pane and select mark as date table in table tools. This enables time intelligence functions to work best by ensuring that calculate modifiers placed on the date table override any other filters placed on it.
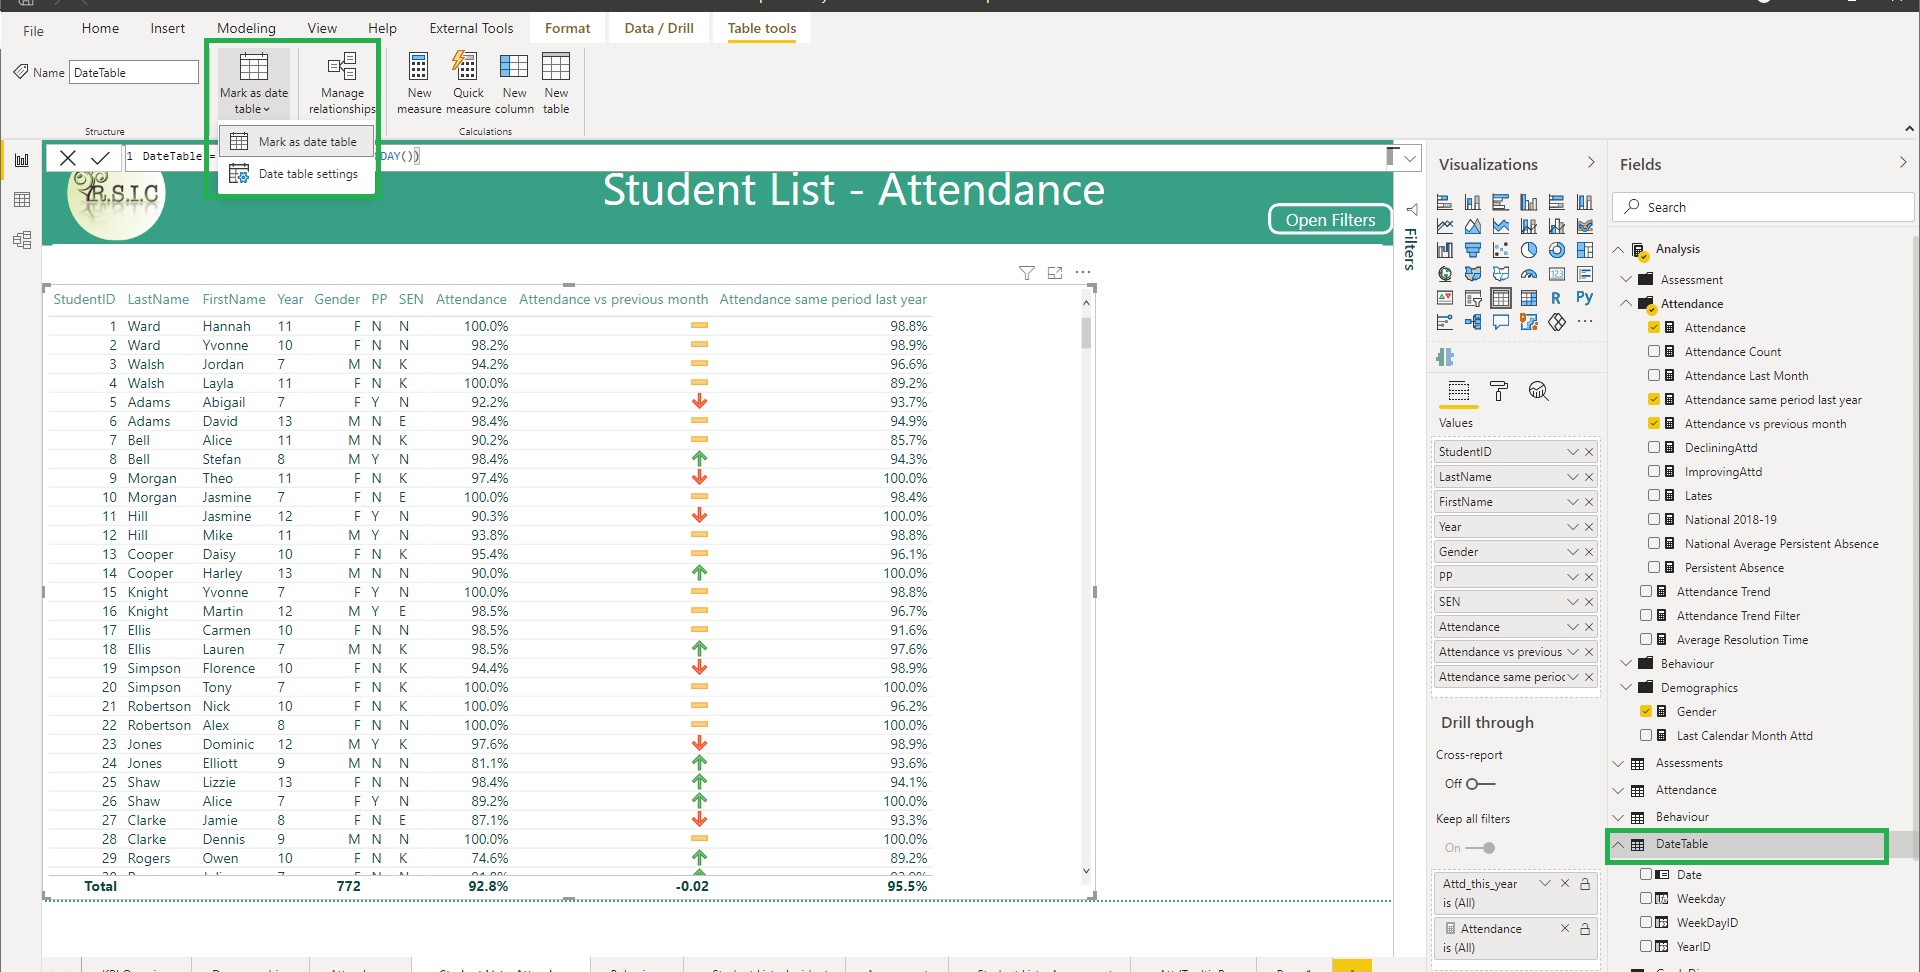
Now that you have your date table hooked up to your attendance table you can use its fields to filter your data.
Time intelligence functions - SAMEPERIODLASTYEAR
Now we get to the good stuff, let’s make a measure that compares this year’s attendance so far with the same date range from the previous year:
Attendance same period last year = CALCULATE([Attendance],SAMEPERIODLASTYEAR(DateTable[Date]))
How easy was that! SAMEPERIODLASTYEAR returns a table of dates with whatever’s currently filtered on the date table shifted back a year. Note that this will still work even if the Academic Year column of the date table is filtered to the current academic as long as the table is marked as a date table.
DATESBETWEEN
For looking at shorter intervals there’s a great function called DATESBETWEEN which, like SPLY works as a CALCULATE modifier. The syntax is date column, start date, end date so you can attendance this month like this:
            Attendance this month =

            VAR ThisMonth = DATESBETWEEN(DateTable[Date],TODAY()-30,TODAY())
            RETURN
            CALCULATE([Attendance],ThisMonth)
Note that this is a rolling month not a calendar one – I prefer that as it means you always compare two 30 day intervals and so you avoid weirdness like a student being absent on the 1st of the month and so having 0% attendance for that month.
If you do want to use calendar months you can do so by using the MONTH function to extract the number of the month and the DATE (year as integer,month as integer,day as integer) function to construct the date like this:
            Last Calendar Month Attd =
            VAR RefDate = MAX(DateTable[Date])
            VAR ThisYear = YEAR(RefDate)
            VAR ThisMonth = MONTH(RefDate)
            VAR LastMonth = ThisMonth-1
            VAR LastMonthDays = SWITCH(LastMonth,
                                                2,28,
                                                4,30,
                                                6,30,
                                                9,30,
                                                11,30,
                                                31)

            VAR LastMonthDates = DATESBETWEEN(DateTable[Date],
                                                DATE(ThisYear,LastMonth,1),
                                                DATE(ThisYear,LastMonth,LastMonthDays))
            RETURN
            CALCULATE([Attendance],LastMonthDates)
As you can see it’s also a pain to code, even more so if you want to include the 29th of February. Note that the Time intelligence function PREVIOUSMONTH exists which takes the date table date column as its single parameter, but it returns the month before the earliest date in the filter context. So if your date table was filtered to academic year 2020-21 (ie sept 20 to aug 21) then PREVIOUSMONTH would return all the dates in August 2020.
Attendance Trend
We can use DATESBETWEEN in a slightly more complex measure to show if attendance is declining, static or improving:
            Attendance vs previous month =
            VAR RefDate = MAX(DateTable[Date])
            VAR TrendDirection = SELECTEDVALUE(SwitchAttdTrend[TrendID])
            VAR ThisMonth = DATESBETWEEN(DateTable[Date],RefDate-30,RefDate)
            VAR LastMonth = DATESBETWEEN(DateTable[Date],RefDate-60,RefDate-31)
            VAR TMA = CALCULATE([Attendance],ThisMonth)
            VAR LMA = CALCULATE([Attendance],LastMonth)
            VAR AttendanceMissing = OR(ISBLANK(TMA),ISBLANK(LMA))
            RETURN
            SWITCH(TRUE(),
                    AttendanceMissing,BLANK(),
                    TMA-LMA)
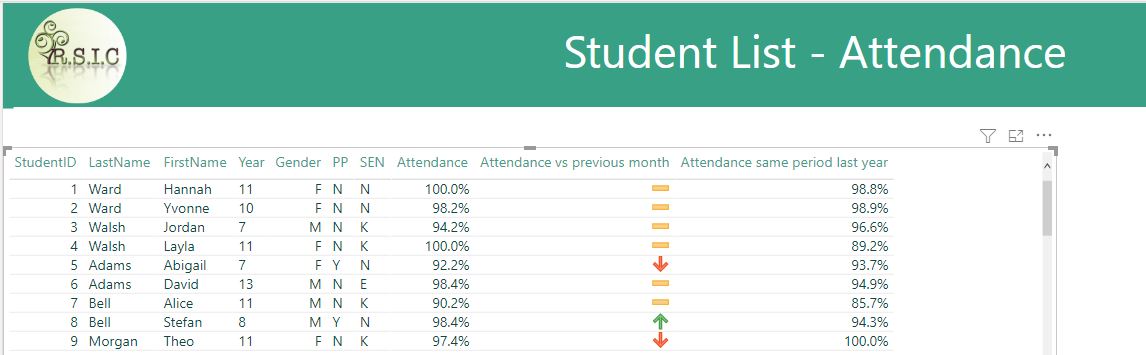
We can put the attendance trend into a table and turn it’s values into icons, using conditional formatting set up like this:
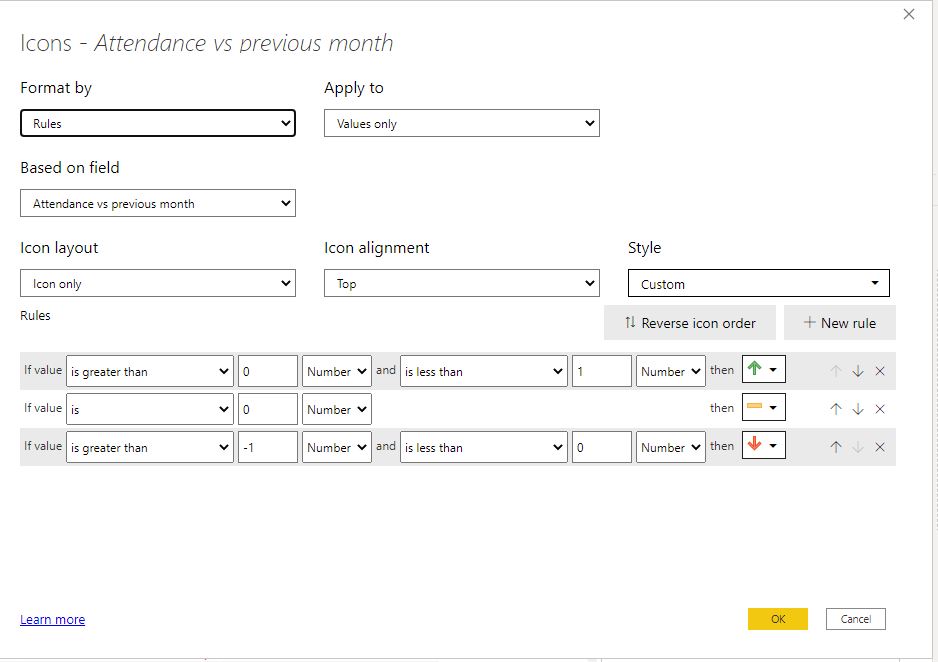
Which looks like this: